Saturday, 3 December 2016

Flex Protocol Scripting in LR

Introduction

Adobe Flex is a software development kit released by Adobe Systems for the development and deployment of cross-platform rich Internet applications based on the Adobe Flash platform. Flex applications can be written using Adobe Flex Builderor by using the freely available Flex compiler from Adobe.
Developers use two core languages to create Flex applications. The first core language is MXML, the Macromedia Flex Mark-up Language, which includes a rich set of XML tags that allows developers to layout user interfaces. Some MXML constructs allow you to call remote objects, store data returned in a model, and customize your own look and feel to MXML components.
The second core language for Flex development is Action Script 2.0, which is similar to JavaScript. Action Script elements are coded inside MXML pages has robust event handling capabilities to allow the application to respond to dynamic user interactions. Unlike JavaScript, since Action Script runs inside the Flash plug-in there is no need to rewrite several versions of the same code to support different browsers.
The Flex server is responsible for translating the MXML and Action Script components into Flash byte code in the form of .SWF files. The SWF file is executed on the client in the Flash runtime environment. The Flex server provides other services such as caching, concurrency, and handling remote object requests. 


Flex Protocol with LR

VuGen allows you to create Vusers that emulate the protocol suite provided with the Flex 2 SDK.

RIAs are lightweight online programs that provide users with more dynamic control than with a standard web page. Like Web applications built with AJAX, Flex applications are more responsive, because the application does not need to load a new Web page every time the user takes action. However, unlike working with AJAX, Flex is independent of browser implementations such as JavaScript or CSS. The framework runs on Adobe's cross-platform Flash Player. 

Pre-requisite
  •     Load Runner 11.0 support the flex with the patch3
  •     JRE 6.0 
  •     Adobe flash player 10 and higher

Environment Variables

Verify for the following environment variables in Windows Operating system.

The environment variables can be reached by following the below steps:

1.    Right-click “My Computer”. Go to properties.
2.    Go to Advanced Tab
3.    Click on the Environment Variables button

Click on the “Ne“button under System variables and enter the below values:

Variable name: HP_FLEX_JAVA_LOG_FILE
Variable value: C:\flex.log

Variable name: VUGEN_PATH
Variable value: C:\Program Files\HP\Virtual User Generator\

Variable name: ANALYSIS_PATH
Variable value: C:\Program Files\HP\LoadRunner\

* The HP_FLEX_JAVA_LOG_FILE is used to generate the log file which will help us to identify the classes involved in a particular transaction.
This log file will be very useful for debugging. Ensure that there are no errors in the flex log file after recording.


Recording Options

The following recording options need to be considered before recording in flex protocol:

·         Go to Tools à Recording Options in LoadRunner.

·         Under Script Check the check box against “Generate recorded event logs”. This setting helps to generate the log files for debugging

·         Under Protocols tab select all three check boxes viz.,

o    Action Message Format (AMF)
o    Flex
o    Web(HTTP/HTML)

·         Under Recording, select HTML based script.

·         Select HTML Advanced button and select “A script that contains explicit URLs only (e.g.web_url, web_submit_data)”  and “Record in separate steps and use concurrent grops” for Non HTML – generated elements
·         Under Code generation select Encode AMF3 using external parser.And provide the below jar files location under Value column.

o    flex-messaging-common.jar
o    flex-messaging-core.jar
o    (Any application specific jars.The jars are dependent on the transaction and should be verified before recording every transaction)  

·         Under Port-Mapping, click on Options. Under Advanced Port Mapping Settings à Change Log level to Advanced Debug. - This setting would enable to generate flex log in C:\ drive.
  
·         The Advanced tab under HTTP properties is the standard one. 

·         Under Correlation tab, uncheck the “Enable correlation during recording” check box.


Post Recording Verification

After recording verify following:

1.    A file by name “flex. log” should be generated in C:\ drive.

2.    flex_amf_call should be generated with readable XML’s and not the binary format for all requests.


Correlation in Flex Scripts

Flex applications often contain dynamic data, data that changes each time you run the script. For example, the object name may change from run to run.

When you record a Vuser script, VuGen records a set of data and argument values. When you replay the script, however, the server may reject these arguments and issue an error. This error could be the result of dynamic data that is outdated and no longer accepted by the server.
To overcome this, you apply correlation to your script:

➤ Save the server response in preparation for extracting the required values.
➤ Extract the required values from the server response.
➤ Save the values to a parameter.
➤ Use those parameters as input to your Flex requests.

These errors are not always obvious, and you may only detect them by carefully examining Vuser log files. If you encounter an error when running your Vuser, examine the script at the point where the error occurred. Often, correlation will solve the problem by enabling you to use the results of one statement as input for another.
To perform correlation:

Locate the step in your script that failed due to dynamic values that need correlation.

Use the Replay Log to assist you in finding the problematic step.


Identify the server response with the correct value in one of the previous steps.

Double-Click the error in the Replay log to go to the step with the error. Examine the preceding steps in Tree View and look for the value in the Server Response tab.


3 Save the entire server response to a parameter.

Before you extract the value, the entire server response should be saved to a parameter as follows:

➤ Right-click the step node (in the left Action pane) corresponding to the server response containing the value and select Properties.
➤ In the Flex Call Properties dialog box, type a Response parameter name.
➤ Click OK to save the new parameter name.

Save the original server response value to a parameter.

➤ In the Replay Snapshot: Response Data, right-click the node above the value (for example, string), and select Save value in parameter.


In the XML Parameter Properties dialog, specify a parameter Name. You will use this name in subsequent steps.

➤ Click OK. The script will now contain a new function, lr_xml_get_values.

Insert the parameter in the subsequent calls.

In VuGen edit view, beginning with the call that failed, replace the value in all subsequent calls to the object with the parameter that you defined:

➤ Right-click the step node (in the Action pane) corresponding to the failed call and select Properties.
➤ Locate the argument that required correlation.
➤ In the Value box, type the parameter name in curly brackets, for example, {ParamValue_string}.
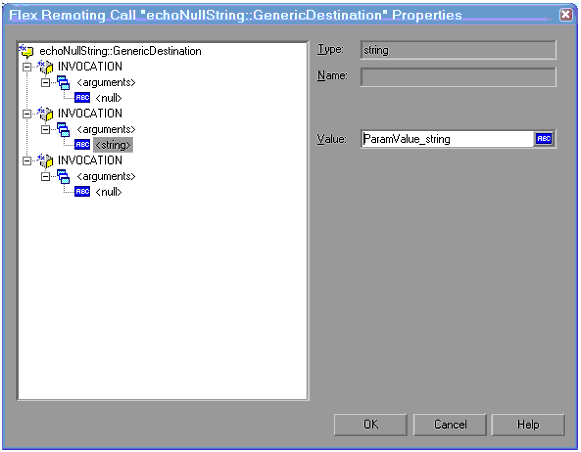


Click OK
 
Run the script.

Make sure that VuGen properly substitutes the argument value with the parameter value that you saved.

Some Important JAR files needed are 


We need application JAR files as well along with these JAR files from developer to generate the decoded AMF calls in the scripts else we can’t parse and correlate the requests.

Wednesday, 23 November 2016

Reasons for High response time

It all depends on you scenario setup. How you have setup scenario to run vusers, is it initialize all vusers simultaneously or is it in ramp up fashion.....so having response time high could be your application as well but again you have to look over your scenario settings then come up with conclusion over high response time.

Execution logs are the logs which got captured during your test based on client server communication.


During on of my project .SWT file was taking longer time.


Response from Team:


Very 1st point generally we should not keep login part in Action section of script as it doesn't seem to be a realistic scenario. Think does real world user (Customer) login and logout that frequently as you are making your application to do in your scenario? My suggestion would be to keep login in init and logout in end section of scripts. But still taking your scenario into consideration.

I am not sure if this way I can help you without having look at the results but still you can try as mentioned below:

1. You must be having .lrr file as test results. (If test was executed in controller)

2. Open .lrr file with Analysis LR component. Let it open complete 100% data. Data generation can be seen at bottom on analysis component.

3. Once 100% data is generated. Open Average Response Time graph.

4. Right click on graph select merge graph and select running vuser graph. This will give you running vuser and average response time graphs in single graph.

5. With this graph you can find exactly after what user load login transaction started taking more time. Once you find the point where login transaction starts consuming more time note down the time and note down what is user load at that particular point of time.

6. Now open other graphs like CPU utilization, Memory utilization (Committed Bytes/ Available MB) check there consumption level if there are normal utilization if you see utilization beyond 90% note down user load and point of time when your server starts consuming beyond 90% level.

Report this to development/Application team with this detail. This will help them.

Ask them to monitor application server from back end while you are running load test. This will give them great understand of root cause.

7. If you have tools like NewRelic,Appdynamics or Dynatrace from there you can drill down transaction wise and find out the culprit behind the high respone time. It could be a database query taking high response time,Network delay, high Disk read/write or multiple queries getting fired for the same transaction.


Tuesday, 22 November 2016

common recording problems

Problem 1: No events are being recorded
Here are the most common reasons why no events are showing in the script:

The events counter keeps increasing, while the generated script is empty
This may be because VuGen’s recording mechanism fails to identify HTTP data. To fix it, ensure that your application indeed uses HTTP Web traffic. If the application uses SSL connections, make sure you choose the correct SSL version (SSL 2, SSL 3, TLS) through the Port Mapping dialog, available by clicking the ‘Options…’ button on the Record > Recording Options… dialog:

The Advanced Port Mapping Settings dialog opens when you click ‘Options…’:

The events counter shows less than five events, while the application keeps getting data from the server
In this case, VuGen’s recording mechanism fails to capture any network activity at all. Ensure that your application really does provide some network traffic, ie. it sends and receives data through the IP network. If an antivirus program is running, turn it off during recording. Check the recording log for any clues about the recording failure. Messages such as “connection failure” or “connection not trapped” can be a sign of the wrongly configured Port Mapping settings.
In addition, if you are recording on a Chrome or Firefox browser, make sure that all the instances of the browser are closed prior to the recording.

Problem 2: Specific events are not recorded
This problem could be caused by the event being dropped as “uninteresting”. By default, VuGen’s Web (HTTP/HTML) protocol records client requests that return an HTTP response status of 2xx or 302, and discards all other requests. If a missing request returns a response that was discarded, such as 301, you can make a modification to the registry to instruct VuGen to generate a command for it:

  • Locate the following registry key:
    • [HKEY_CURRENT_USER\Software\Mercury Interactive\Networking\Multi Settings\QTWeb\Recording]
  • Add the following string value to it:
    • "GenerateApiFuncForCustomHttpStatus"="301"
Problem 3: The recorded application becomes unresponsive during the recording
This could be caused by VuGen’s recording mechanism not being able to connect to the application’s server. Network connection errors can be seen in the Recording Log:

[Net An. Warning  (1068:197c)] Request Connection: Remote Server @ 123.123.123.123 - 5222 (Service=) Failed attempt #1. Unable to connect to remote server: rc = -1 , le = 10060)
[Net An. Warning  (1068:197c)] Request Connection: Remote Server @ 123.123.123.123 - 5222 (Service=) Failed attempt #2. Unable to connect to remote server: rc = -1 , le = 10060)

Note: the Recording log is in the ‘Output’ pane.  Make sure ‘Recording’ is selected in the combo-box on the left:

In order to fix this problem, the Port mapping for the specific IP and port should be added to the Port Mapping dialog (under theRecord > Recording Options… menu), and the entry should be unchecked. That will ensure that the above IP and port are not recorded – that application simply connects to them without any LoadRunner involvement. For the messages above the correct setting would be:

This workaround can be done in case the communication to 123.123.123.123:5222 is not important for the business process and can be omitted. If that’s not the case, the same entry should still be added, but left as checked. That will ensure correct traffic capture to this address.

Problem 4: During the recording the recorded application shows an error message about the wrong server certificate
The problem is caused by the inability of the client side to verify the validity of the server certificate. In order to fix this problem, the LoadRunner Certificate Authority (CA) file should be added to the machine’s “Trusted Root Certificate Authorities” certificate store (in case of a Java client application, LoadRunner’s CA should be added to Java’s trusted CA list using the keytool). This file is supplied with LoadRunner, and is called wplusCAOnly_Expiration_2022.crt. It’s located in the <LR_folder\bin\certs> folder.

To add it to the store, double-click on the file to open the certificate:

Then click ‘Install Certificate…’ to open the Certificate Import Wizard’:

Make sure you check ‘Place all certificates in the following store’ and select ‘Trusted Root Certification Authorities’.  When the wizard is completed, you should be able to record the application.

Problem 5: The browser crashes during recording when using the Ajax Click and Script protocol
This can happen when some of the Ajax controls inside the application are not recognized by VuGen. In order to fix it:

  • Go to the  <LR_folder\dat\protocols> folder and open the WebAjax.lrp file
  • Comment out the following: DllGetClassObject:jscript.dll=DllGetClassObjectHook:ajax_hooks.dll (simply put a semi-colon (‘;’) in front of the line)
You should now be able to record the application.


We hope you found this article useful.  Let us know by leaving a comment in the box below.

Monday, 7 November 2016

Dynamic Value in Response Header and Need to corelate

Go to Recording Options / HTTP properties / Advanced / Headers and add 'x-csrf-token' or select 'Record header not in list'.
Then record or regenerate the script.

Note: the header name (in web_add_header) is without the colon (:) or space. The right boundary in web_reg_save_param should be \r\n not =


web_add_header("x-csrf-token","{XCsrfToken}"");


The header looks like as follows in server response,

 x-csrf-token: 0FTcidqErDFSk1hTsw0rIw==

I have tried to correlate the function as follows on a proper request,

web_reg_save_param("XCsrfToken","LB=x-csrf-token:  ","RB=\r\n","Search=Headers",LAST);


To remove this error, go to recording options->Preferences-> headers and add C-XSRF Token in headers via clicking this option and regenerate your script again.


Sunday, 6 November 2016

Converting Fiddler Session To VuGen Script In Loadrunner

In this tutorial, I will show you how to convert Fiddler session to Loadrunner Script.

Download the fiddler from the following website: http://www.telerik.com/fiddler. You can also download chrome extension of fiddler here.


Click on Install, once you download the Fiddler, as shown in the following images.


Fiddler Installation 1

Fiddler Installation 2


Fiddler Installation 3

Fiddler Installation 4

Once you install the Fiddler go to Start -> Programs and Search for Fiddler OR go to Internet explorer and click on tools and click on Fiddler.

Fiddler Launch

Once you launch the fidller, click on WinConfig and Click on exempt all and click on save changes.

WinConfig Settings

Now, open the application in the internet explorer. The events will be automatically recorded in fiddler as shown in the following image.

Recorded Events

Once the navigation has been completed, click on save sessions.

Save All Sessions

The file will be saved with .SAZ extension.

Open the vugen, click on File Open->script/solution and select all files as shown in the image. and select the .saz file. 
All Files


The vugen will automatically converts .SAZ file to Loadrunner script.

Generating Vugen Script


Generating Vugen Script 2

Siebel Web Protocol In Loadrunner

Siebel Customer Relationship Management (CRM) is one of the top CRM applications, which help organizations to achieve maximum sales, marketing, customer service etc.

Siebel protocol is similar to Web (HTTP/HTML) protocol, but has made lot of changes to the settings to work with Siebel Web Protocol. It is one of the complex protocols where we face lot of issues during scripting, but HP has provided predefined correlation rules, which will help you the scripting easy.

Before recording make sure you set the following recording options:

  1. Go to Recording Options (CTRL+F7) -> Recording -> HTML-based script -> HTML Advanced and set “A script containing explicit URLs only (e.g. web_url, web_sumit_data)”.
    Siebel Recording Options 1
    Siebel Recording Options 1
  2. In, “Non HTML-generated elements (e.g. JavaScript, VBScript, ActiveX, Applets)” set “Do not Record”.
  3. Go to HTTP Properties -> Advanced node and set “clear the Reset context for each action check box”. 
    Siebel Recording Options 2
    Siebel Recording Options 2

Set the following run-time settings after recording:

Go to Run-time settings -> Browser -> Browser Emulation and set “simulate new user on each iteration”.

Siebel Runtime Settings
Some of the Common Errors in Siebel Protocol:

Back or Refresh Error:

We get error, when we pass the wrong TimeStamp or SWEC Count. For every request, the SWEC count will increase, if we pass the wrong SWEC, it will fail by throwing “Back or Refresh Error”.

Server Busy Error:

The following error is one of the common error which we get frequently during scripting and execution.

"The server you are trying to access is either busy or experiencing difficulties. Please close the Web browser, open a new browser window, and try logging in again.[01:55:21] "

The main cause for this the sessions might be less, we should ask for Siebel administrator to increase the sessions in the server.

The following commands will be useful to increase the sessions in the server:

srvrmgr:dev_srv1> CHANGE PARAM MAXMTsERVERS=4 FOR COMP eautoObjMgr_DB
Command completed successfully.

srvrmgr:dev_srv1> CHANGE PARAM MAXTASKS=400 FOR COMP eautoObjMgr_DB
Command completed successfully.